Improving the online presence of your business website while continuing to optimize it for search engines is a daunting task. It requires a thorough analysis of several Google ranking factors and important SEO metrics. The best tool to help you with this task is Google Analytics.
Ambitious entrepreneurs have a tendency to get lost in Google Analytics (GA) as they spend time analyzing reports which have little to do with the growth of their business. Most of these entrepreneurs focus on “vanity metrics” such as the number of visits their website previously had, rather than remembering to look at the data in a way that supports business objectives.
Here’s a list of five Google Analytics best practices to get you started using it to its full advantage:
1. Focus on Your KPIs
It’s essential that you focus on your Key Performance Indicators (KPIs are important, success metrics in achieving your website or business objectives) to understand your GA reports. Creating and then tracking KPI reports is an essential Google Analytics best practice if you want to accurately measure how your website is performing online.
A couple KPIs you might consider for your website would be the amount of monthly traffic to a specific product page or the percentage of traffic your website is receiving from a particular age group. Your individual KPIs will depend on what your goals are, who your target audience is, and what type of small business you are.
Whether you’re managing your own Analytics account or you’re hiring out for it, you need to be aware of all the sections Google Analytics has to offer and where your most important reports will be. If there are sections and reports that aren’t that important, that’s OK. Focus your resources on what’s really important to your small business goals.
2. Create Custom Dashboards
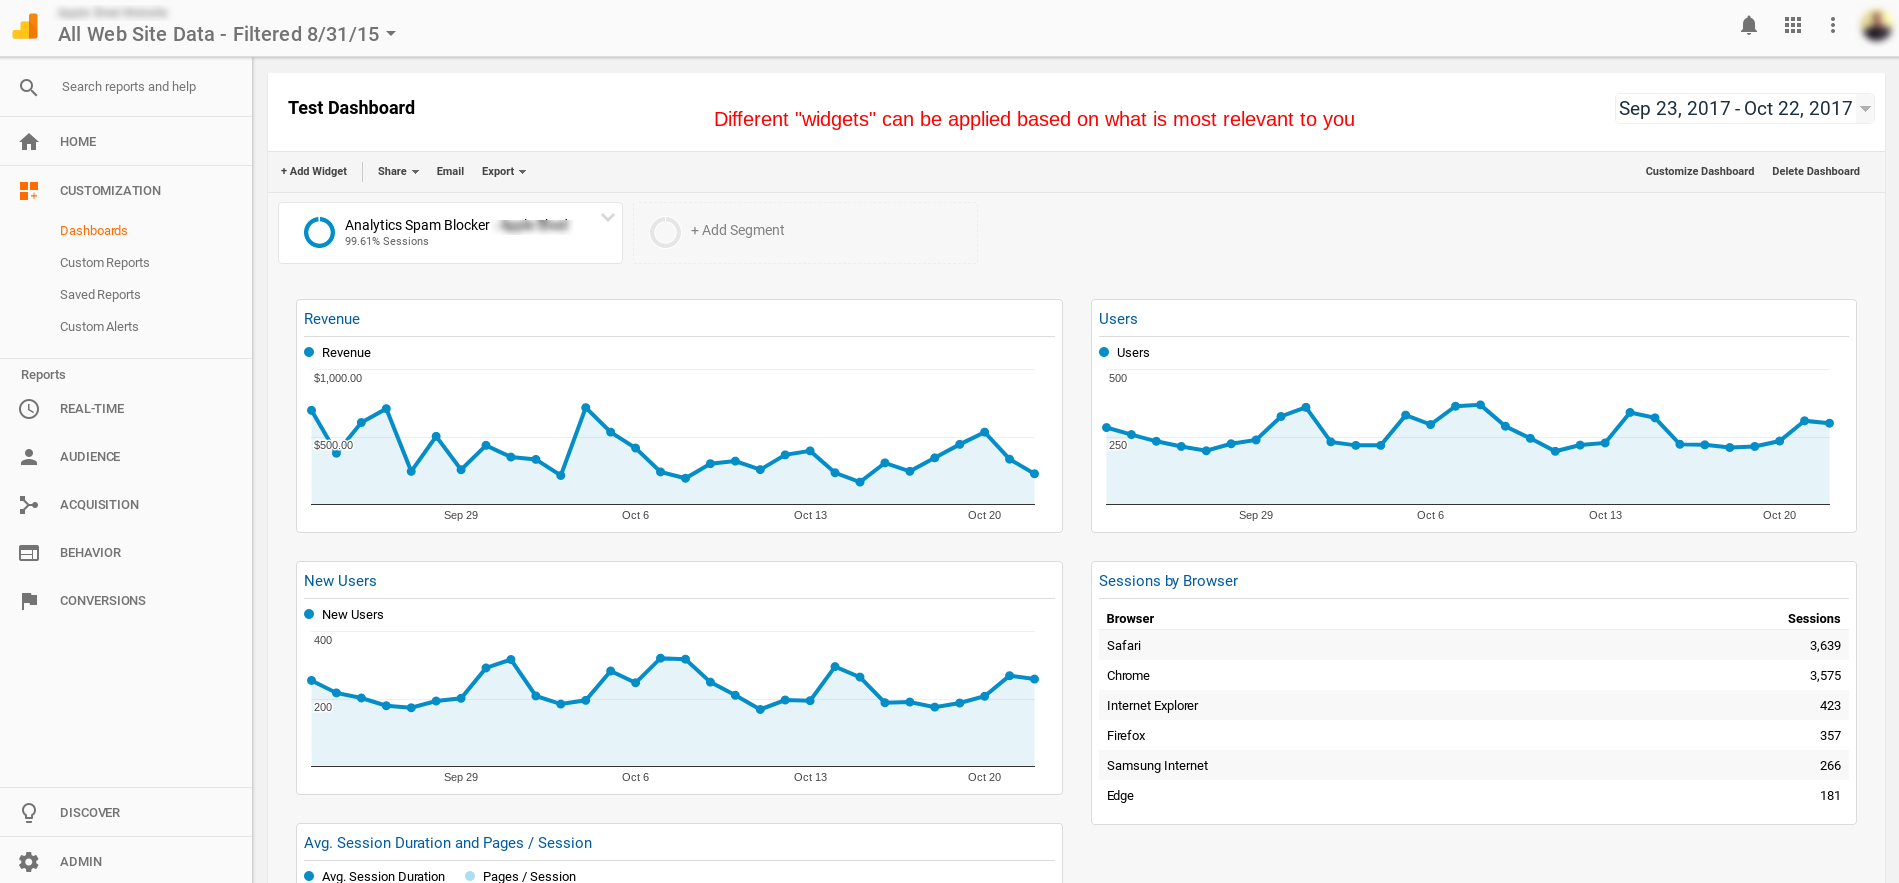
Google Analytics allows you to customize your dashboards and access your most valuable data quickly.
As you develop your Analytics profile, you may want to create a dashboard with an exclusive focus on the KPI’s pertinent to your business.

Follow these steps to create a custom dashboard in Analytics:
1. Log into your Analytics account
2. Click on “Customization” on the left hand side navigation and then “Dashboards” from the drop down menu
3. In the Dashboards section, click the “Create” button. You’ll have two options: Blank Canvas or Starter Dashboard. If you want to completely customize your own dashboard, select Blank Canvas
4. Once in the Blank Canvas section, click “+Add Widget”. Select the type of widget you want, the metric dimensions, give it a name, and so on. Then click “Save”.
3. Create Goals in Google Analytics
Working with defined and set goals is a crucial Google Analytics best practice for measuring performance on pages, marketing campaigns, lead conversions, and so on. It’s also a great way to increase high-quality traffic to your site.
By creating specific goals in GA, you’ll be able to directly measure the success rates coming from your small business website. Measuring your goal conversions will ensure that you are on the path to achieving your business objectives and making the right decisions.
Goal conversion rate is a crucial KPI since it can often directly reflect the quality of the user experience on that page.
Figure out how to create goals in Google Analytics by following these steps:
1. Log into Analytics and click on the “Admin” tab on the bottom, left hand side navigation.
2. Once there, navigate to the “View” column and click “Goals”. Click “+ NEW GOAL”.
3. You can either create a custom goal or use an existing template. Choosing the template option allows you to measure some popular website metrics and takes a lot of the finer detail setup options out of the equation. So, if you’re looking to set up some basic level goals, you may want to check out the template options to save you some time.
4. Next you’ll need to fill out the necessary boxes (like the goal name and the goal type) to create your goal. Once you’ve finished filling in your information, click “Verify Goal” to make sure it’s working properly.
5. Once you’re sure you’re Goal setup is complete, click “Create Goal” and Analytics will automatically start tracking your website data.
4. Analyze Your Data Charts
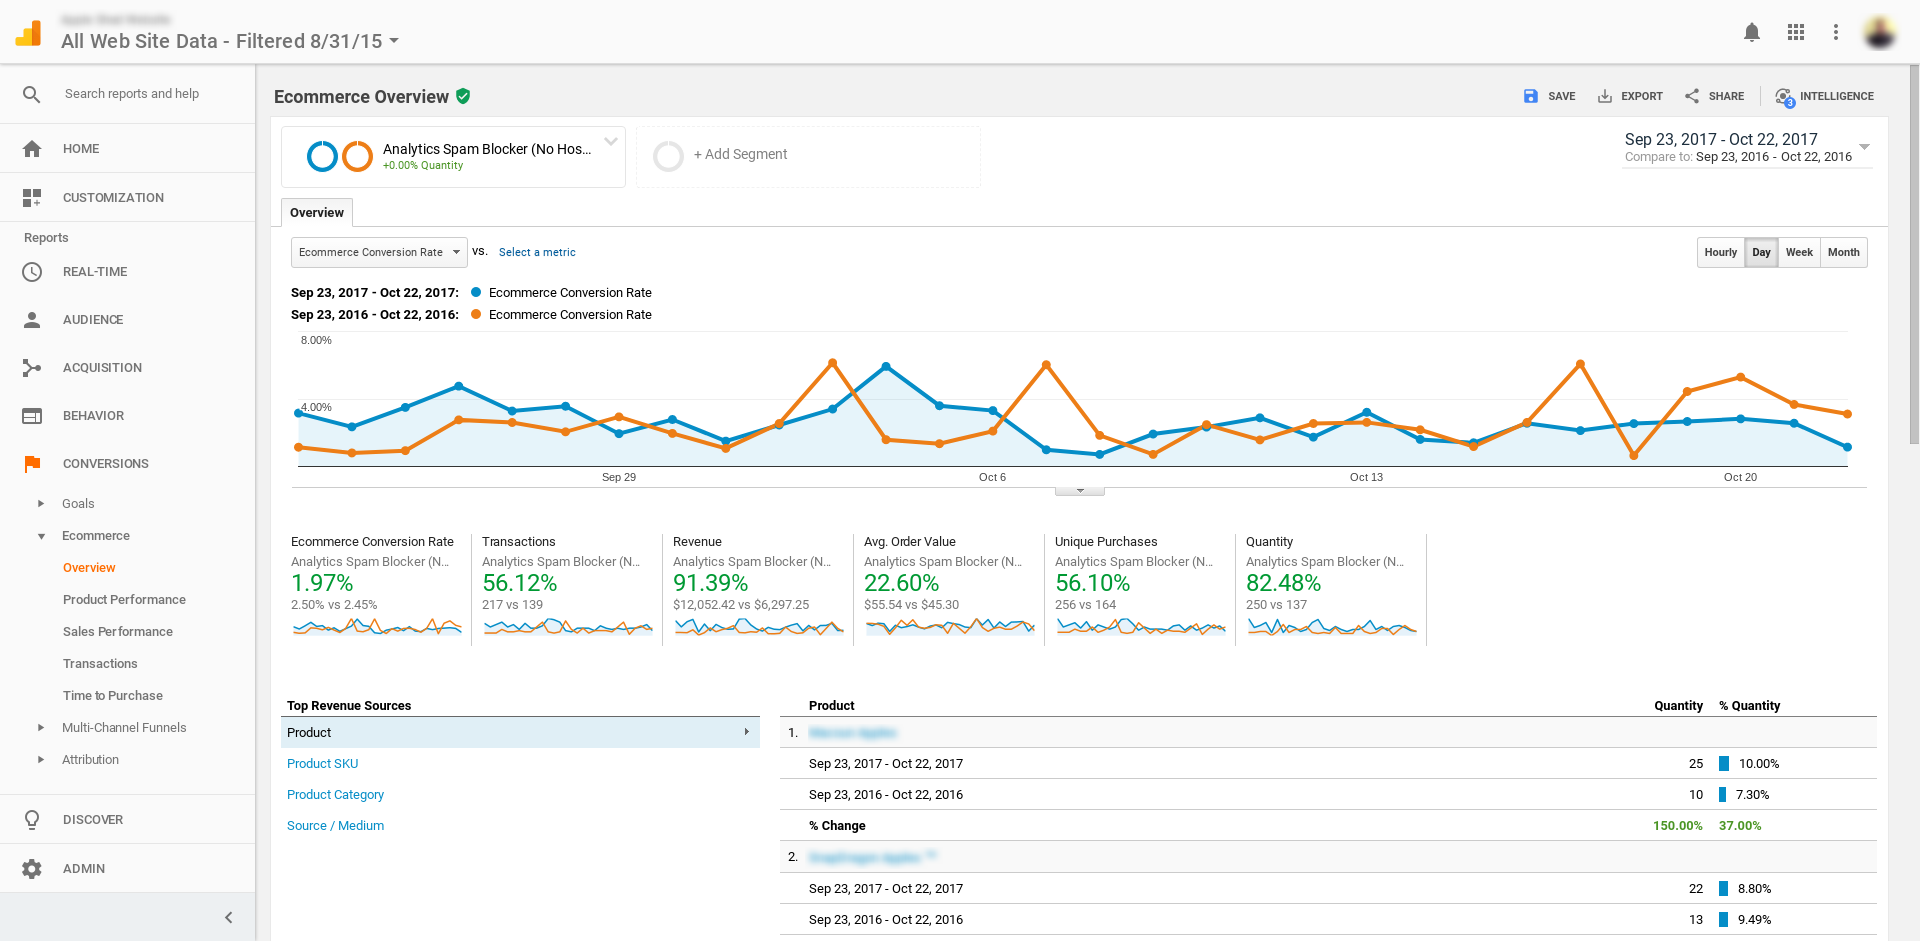
The best way to measure your progress is to compare your results over time. By default, I would advise having the results of the last 30 days displayed. You can adjust the comparison range easily for every chart available as well. Additionally, the ‘compare to’ checkbox allows you to compare current results to any other days’ reports in the past.
The rule of thumb when analyzing your current data is to compare it to historical data so you can calculate improvements or problems. After all, the best way to realize what works and what doesn’t on your website is to compare results, before and after effecting change. I prefer to measure year-over year traffic whenever available, starting at a full 12 months over 12 months to observe any notable trends or unexpected spikes/dips in activity. Year-over-year results allows for seasonality of website activity to be effectively captured. However, if your website is fairly new, just work with what you have to start off.

5. Eliminate Office IP Website Traffic
Google Analytics is a great tool for you and your web developer to use when measuring progress. Analytics is more useful (and accurate) when any traffic generated by your IP address is eliminated. The IPs from your office, home connection, and web developers need to be filtered out of your reports, thus ensuring that only “clean” traffic gets recorded.
To filter out your own office traffic from your Google Analytics reports follow these steps:
1. Log into Analytics and click on “Admin” on the left hand side navigation
2. Under the “Account” column, click on “All Filters” and click the “+ ADD FILTER” button.
3. Name the filter and enter the IP address you want to exclude. Click “Save”.
Pro Tip: Applying a filter at the administrative level in Analytics will actually block the reporting of that data, so I recommend creating a “master” view with no filters, for any needed reference points.
In Conclusion
Applying the above Google Analytics best practices to the running of your website can entirely change the direction your small business is heading. Google Analytics is a tool that will ensure the progress being made by your site is noted and the weaknesses in your site get resolved.
