
Although data surrounds us everywhere we go, it’s often hard to comprehend the numbers. However, when we put it into a story, like an infographic, it’s much easier to understand. Infographics are one of the most effective storytelling tools used by marketers today, but creating a good infographic takes time and effort.
Essentially, an infographic is an in-depth illustration of the story you’re trying to tell. It’s much more than just a pretty picture.
Follow these 10 steps to create an informative, well designed infographic that you and your viewers love and appreciate.
Best Practices for Creating a Good Infographic
1. Less is More
Our best advice is to value simplicity over all else in your content. Remember the saying “less is more”. In truth, your infographic can tell a bigger story than you think.
This is an infographic our Content Marketing Manager created on start ups. As you can see, it’s pretty straight forward and simple. It has one supporting image per point and a consistent color scheme throughout.
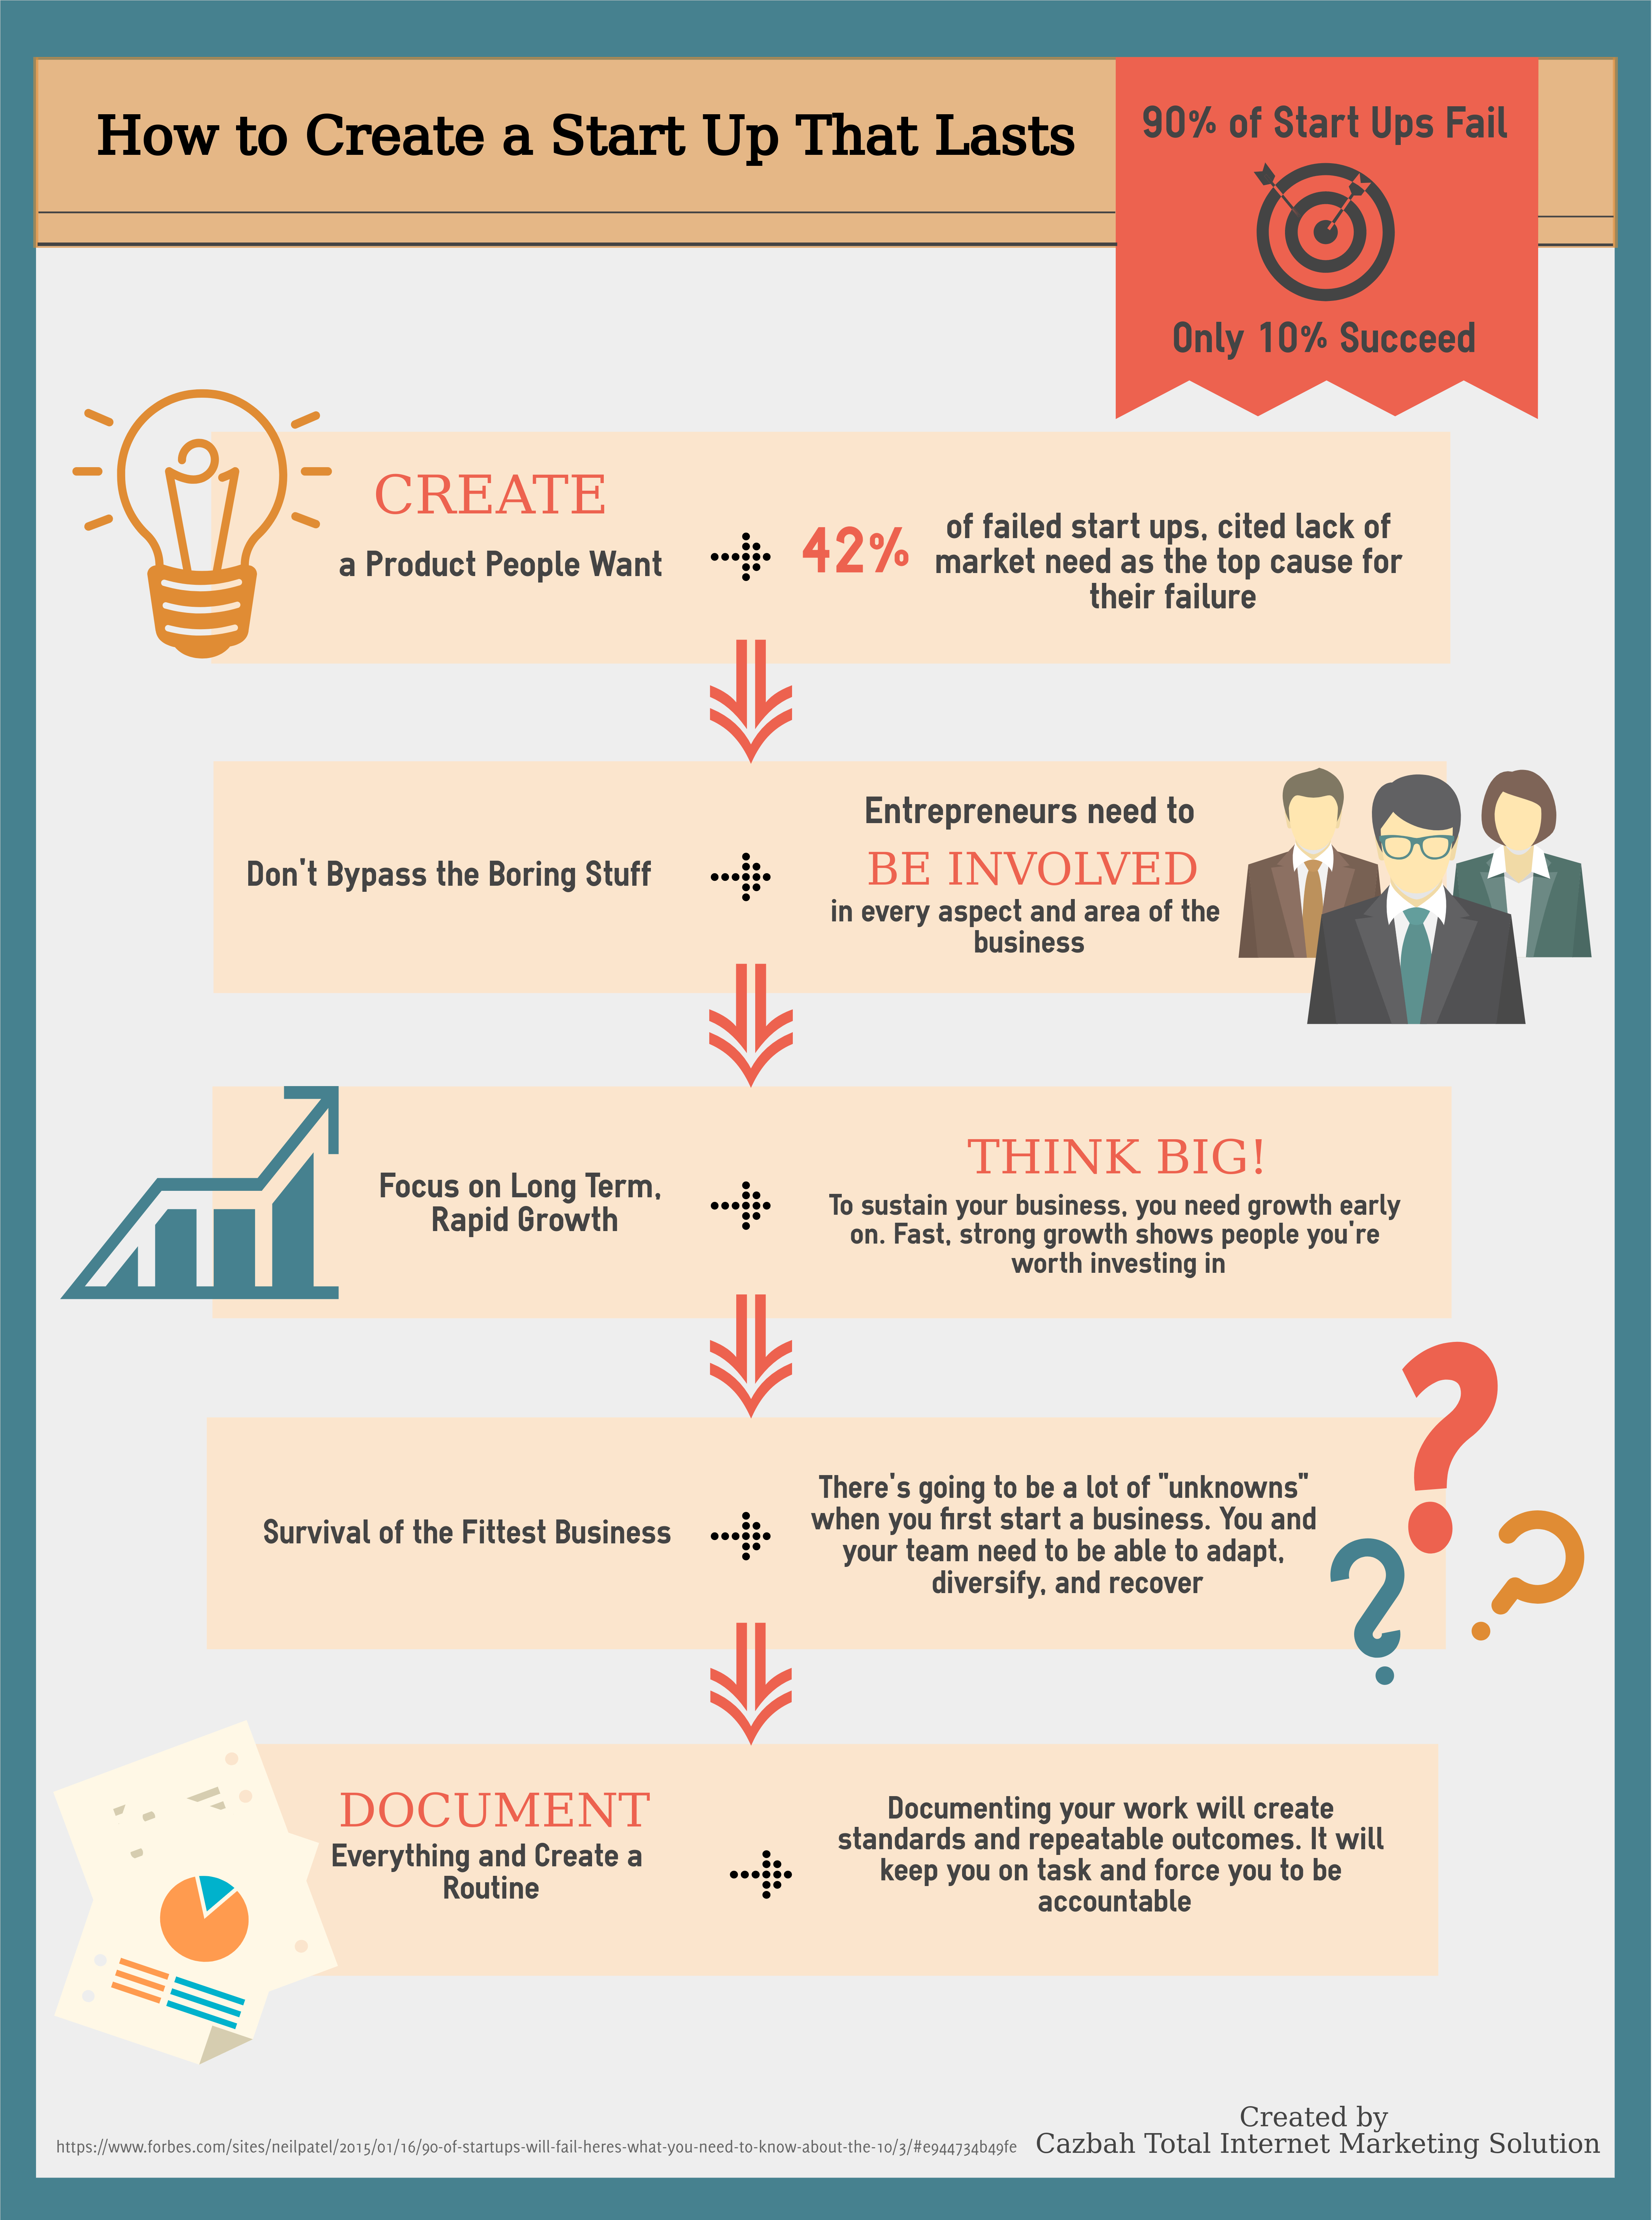
Copious, unorganized information won’t help your infographic. Instead, focus on creating effective charts and images that support your point.
2. Your Message
Implement background information and statistics make your message more convincing. Viewers want to see proof of what you’re telling them. Depending on the type of infographic, you may be able to include reviews or testimonials as well.
If you have new info you want to present in your infographic, include it in a manner to promote focus by surprising your reader with it. Holding your reader’s attention is easy when you have a fact to challenge them or draw them in. Create an infographic for a fresh idea or topic. However, infographics are also great methods to re-state and re-discuss evergreen topics in your industry as well.
3. Use your Infographic to Attract Your Target Audience

Create an infographic with your target audience in mind from the get go. A common mistake that marketers make when creating infographics is choosing a theme that’s too generic for their target audience. Go deep, not wide! Focus on a specific idea for a specific audience and do it better than anyone else.
4. Balance Visual and Written Info
Some infographics tend to have an imbalanced representation between content and images. Images help to lead the eye through the infographic to important topics. The images you include should relate to your content and illustrate the idea of it. Make sure your images flow and are strategically placed.
5. Promote Your Infographic
Once you create your infographic, you need to raise attention for it. Grab your megaphone and let people know about it! You have to promote your work in order for it to reach your target audience and gain popularity. There are are a few ways to do this: One, reach out to industry influencers and offer your infographic to them and two, share it on your media sites and ask your followers to do the same. A good way to start an infographic is to find a great article, create an infographic based on that article’s content, and offer to share your infographic with the article’s author.
Do yourself a favor and work hard to promote your work in the beginning to avoid letting your infographic go unnoticed.
6. Sizing and Viewing
One reason an infographic goes unnoticed is due to its resizing. There needs to be communication between the designer and the web developer on the layout and expected size of the infographic before it’s published. Design your infographic with the end presentation in mind, whether its viewed on a mobile or standard computer. This way, whether the reader enlarges it or not, the infographic is easy to read and understand.
Although infographics are intended to be large, if you make it too big, you risk causing confusing. Your readers may not be able to understand your infographic because they won’t be able to see it all at once without scrolling. The purpose of creating a graphic to make understanding your content easier, not harder!
7. Incorporate White Space
Good infographics have a lot of white space. White space is your friend! Just like in a blog, white space in an infographic helps important headers or images stand out. It also helps to unite the entire infographic visually. White space helps your user’s view while they look at your infographic. If you don’t include it, you’ll have an imbalance of visual elements.
8. Adopt a Great Headline
Before publishing your infographic, make sure you create an attention-grabbing headline. Your headline has to get the attention of your readers to get views.

A great headline will describe your infographic, grab the attention of your readers, and be short enough to portray the main theme quickly.
9. Double Check Your Information
The goal of infographics is to present information easily.
Before you publish your graphic, make sure you double check all of the information you included. After all, you always want your content to be as accurate as possible.
This step is especially crucial for infographics that rely strongly on stats. So look it over, look it over again, and have a friend look it over to be sure everything is right.
10. Cite Your Sources
Even though you’re the one creating the graphic, you still need cite your sources. Make sure the information you use is the most recent available to you. If you use dated facts or information, your infographic becomes less valuable.
Where to Find Infographic Templates
By now you know the do’s and don’ts of making a good infographic.
However, you may still need a hand getting started. If you are new to making infographics or don’t have access to a graphic designer, you can use these tools and templates to create infographics for your business:
– Canva
– Visme
– Venngage
– Easel.ly
– Infogram
How To Organize Your Information
A good infographic is fluid, both visually and cognitively. It should read like a story, moving seamlessly from one idea to the next.
All your points should connect to each other and take the reader to a specific conclusion. The flow of your infographic should prioritize simplicity and be easy to follow, this will help keep your viewers engaged.
There are a few ways that you can best organize your information:
– Alphabetical: Arranging your information alphabetically is a great way to add structure to a broad topic.
– Chronological: If you are presenting the history or evolution of a subject, you may want to present your info in a chronological timeline.
– Data Representation: This is an easy way to present statistics, figures, and charts in an eye-catching and persuasive way.
– Comparison: With this method, you can compare and contrast two+ ideas or elements with simplicity and ease.
In Conclusion
Creating a good infographic is no easy job. But, when you put in the work, you’ll realize how powerful and impactful your words can be. Comment below to let us know your favorite methods to create infographics!
Want More Info on How to Grow Your Business?
Check out our website and get a FREE comprehensive analysis on why your site is not performing and how to fix it!
Check out our blog page for more useful articles on a variety of topics!