
Reviewing your website’s analytics not only allows you to track the internet marketing metrics of your website, but doing so is also vital to understanding your online audience. Google Analytics reports provide us with a plethora of important information, such as how many people are visiting the website, how long are they staying, and where they are coming from.
This data helps us to form an image of those that have visited and determine what they need. Of the many metrics provided, the one that seems to be the most misunderstood is bounce rate in Google Analytics. To truly understand what “Bounce Rate” means, other metrics and web page information needs to be taken into context.
What is Bounce Rate?
Google Analytics defines “Bounce Rate” as “the percentage of single-page visits” (visits in which the person left your site from the entrance page without interacting with the page).
For example, if your website gets 10 visits on a particular day, and 4 of those visitors only viewed the page that they entered the site on and left, the bounce rate for that particular day would be 40%. It’s important to note that even though the term “bounce” might suggest that the person comes to the web page and leaves quickly, the amount of time spent on the page is irrelevant.
Usually, once people hear the definition of bounce rate in Google Analytics they automatically associate a “bounce” as being a bad metric. People see high bounce rates as visitors coming to a website and then soon leaving without exploring any other page on the website. Many people worry that bounce rates directly correlate to visitors not finding the information they’re looking for and quickly leaving. But, there are two sides to the coin, so to speak. Sure, it’s possible that those that bounced came to the site and left because the information wasn’t relevant to what they were looking for. However, they also could’ve come to the exact page, containing the exact information that they were looking for.
Before you go making any quick assumptions, take some time to view the web page in question and consider it’s purpose for your website.
How to View Your Bounce Rate in Google Analytics
If you want to get down to the numbers in Analytics, there are a few places you can go.
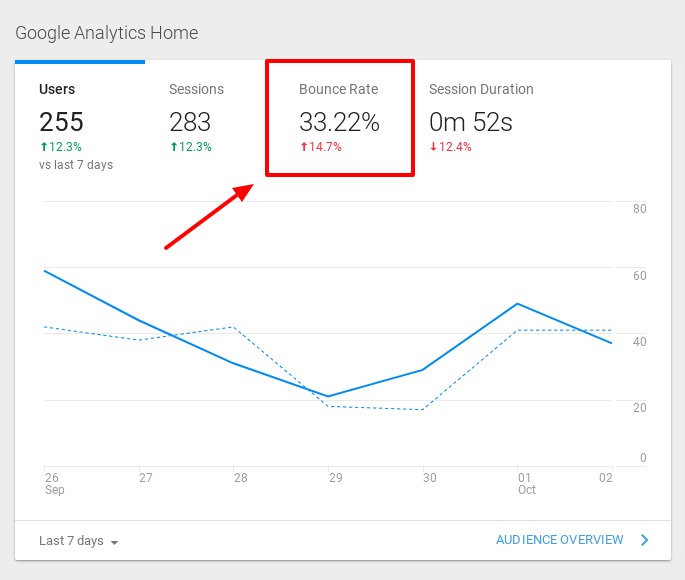
Once you log into your Google Analytics account, your regular home dashboard will appear. The chart that appears at the very top, left of your dashboard represents your website’s over-all metrics, including “Users”, “Sessions”, “Bounce Rate”, and “Session Duration”. Again, the bounce rate percentage that you see here is not page specific. It represents the average of all your web pages within a specific time frame.
A general overall view of your website’s metrics can’t hurt, but to really understand bounce rate in Google Analytics, you’re going to want to view it on an individual page level.
Here’s what you need to do:
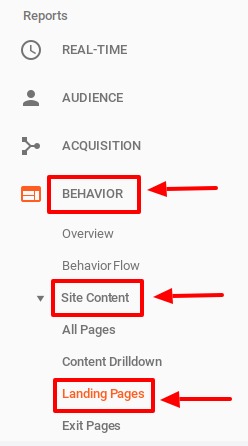
Step 1: Once you’re logged in Analytics, select “Behavior” on the left hand side navigation
Step 2: In the drop down menu that will appear, select “Site Content”
Step 3: In the drop down menu that will appear, select “Landing Pages”
A graph and a generated list will appear on the page of your most popular web pages, listing all the metrics that apply including bounce rate. For each individual page, you’ll be able to see how each set of metrics compare to each other so you can get a better idea of how certain pages are performing. You should be mindful of the time range you select in your view as well. Different times ranges could impact your metric percentages.
Looking at your metrics on an individual page level will help you determine if your bounce rate number is “good” or “bad” on a case by case basis.
The Comprehensive View of Bounce Rate
Having a high bounce rate in Google Analytics isn’t always a “bad” metric to have. You can’t just look at one set of numbers to determine how well optimized and designed your web pages are, you need to look at the whole picture.
You need to know the purpose of the page before you can fully understand what your bounce rate metrics actually mean. If your web page is meant to purely inform your reader and provide them with specific information to answer question, a high bounce rate could be considered good! Maybe a web visitor found all the information they needed on the page they landed on and then left. That’s definitely not a bad course of action, but analytics will register it has a high bounce rate all the same. Context matters!
High bounce rates can actually come as a result of successful internet marketing strategies and proper web page design. It’s important to remember, that the goal of a well-optimized website should be to get visitors to the information they’re looking for and quickly convert them into leads, in the form of phone calls, contact form submissions, phone calls, or sales.
In Conclusion
When taken out of context, a website’s (or web page’s) overall bounce rate in Google Analytics can be very misleading and distract from other important metrics that Google Analytics has to offer. However, it’s important not to discount bounce rate altogether, as a high bounce rate might serve as an indication to check into a potential problem. The key is to not let bounce rate be the sole driver of decisions to change your web pages, but rather use it in conjunction with the other metrics provided, to tell the whole story of your online audience, allowing you to make well-informed decisions from there.